Key Takeaways
- Retirement dashboards offer a visual, organized approach to managing retirement income and expenses.
- Accurate setup and regular reviews help you maintain reliable insights for confident, informed retirement planning.
Planning for retirement can feel overwhelming with scattered statements and predictions about your future. A retirement dashboard helps you view your complete retirement picture in one place, making it easier to understand and manage important decisions. In this article, you’ll discover what dashboards do, how they help, and how to use them effectively in 2026 and beyond.
What Is a Retirement Dashboard?
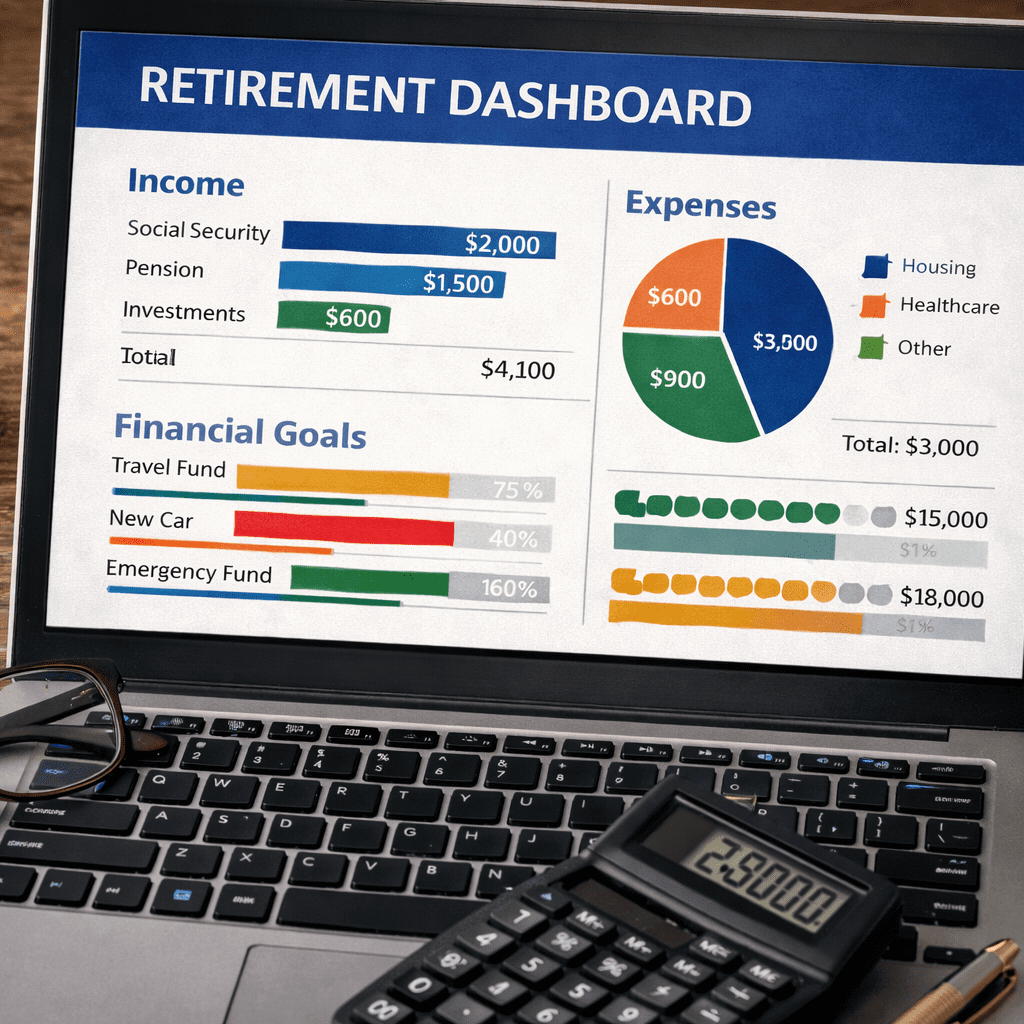
A retirement dashboard is a digital tool designed to organize and present your retirement finances in a clear, visual format. It brings together account balances, income sources, and projected expenses, allowing you to view your entire retirement situation at a glance and understand how each piece fits together.
Key dashboard features explained
Good retirement dashboards consolidate a variety of financial information. These features often include:
- A summary of account balances across savings, retirement plans, and investments
- Income source tracking, such as Social Security or pension streams
- Charts and graphs showing historical and projected income and expenses
- Goal-setting features to help you plan for major events or milestones
- Alert functions that highlight inconsistencies or gaps
How dashboards support retirement organization
Having all details in one place encourages you to stay organized and proactive. Dashboards make it easy to:
- Spot changes in your financial readiness
- Track the impact of lifestyle choices or spending changes
- Maintain up-to-date records so you’re always informed
Why Use a Dashboard for Retirement?
Retirement dashboards go beyond recordkeeping; they transform complex financial information into practical visuals and insights that you can use to make thoughtful choices.
Benefits of financial visualization
Seeing your finances laid out in graphs and projections helps build understanding. Visualization brings clarity to key questions, such as whether you’re on track to meet your retirement goals, or how a change in expenses could affect your financial future. A dashboard’s visuals help convert data into meaningful information, making it easier for you to spot trends.
Simplifying complex retirement planning
Retirement planning includes many moving parts, from managing different income streams to anticipating various expenses. Dashboards simplify this complexity, connecting the dots so you can see relationships more clearly. By providing all your main data in one location, dashboards make retirement planning feel more manageable and less stressful.
How to Set Up a Retirement Dashboard
Creating a functional retirement dashboard starts with solid groundwork. Following a step-by-step process ensures the data you see—and rely on—is both complete and accurate.
Step 1: Gather financial data
First, collect all relevant financial documents and account details. This includes:
- Retirement accounts (such as IRAs and workplace plans)
- Social Security statements
- Bank account balances
- Healthcare expenses and insurance summaries
- Records of any pensions or other lifetime income sources
Having clear, current data will help make your dashboard truly useful.
Step 2: Input and organize information
Enter your gathered data into the dashboard platform, making sure to place information in the correct sections. Most dashboards allow you to organize sources of income, categorize expenses, and specify retirement goals or milestones. Spend time customizing categories to reflect your unique situation.
Step 3: Verify accuracy of data
Before relying on any summary or projection, double-check every entry. Confirm account balances and income sources, and review entries for common mistakes like data duplication or missing values. The quality of insights from your dashboard depends on the accuracy of its underlying data.
Which Dashboard Features Matter Most?
Not all dashboard features are created equal. Focus on those that deliver insight into your unique retirement needs and support your long-term planning.
Tracking multiple income sources
Many retirees draw income from more than one place: Social Security, pensions, personal savings, or even part-time work. A dashboard should track each source separately and together, letting you understand how they add up and if any gaps remain.
Visualizing healthcare expenses
Healthcare often becomes one of the largest and most unpredictable expenses in retirement. Dashboards should allow you to enter and track healthcare outlays over time, including insurance premiums, out-of-pocket costs, and expected future care. This visual aid can help spotlight trends and anticipate future needs.
Setting and reviewing retirement goals
Your financial dashboard should let you define clear retirement goals—like travel plans, home improvements, or support for family. Tracking progress towards these objectives helps you stay motivated and adjust saving or spending as required.
How Do Dashboards Track Retirement Income?
One of a dashboard’s most valuable functions is monitoring and projecting various streams of retirement income, which is crucial for consistent monthly planning.
Monitoring Social Security sources
Many dashboards offer dedicated fields for entering Social Security estimates. As your benefits begin, you can track monthly deposits, review annual statements, and notice changes in payment structures as rules evolve.
Incorporating various savings accounts
Since most people hold accounts at more than one institution, a reliable dashboard will aggregate balances across your various retirement and savings accounts. Watching these totals helps you visualize drawdowns and inform withdrawal strategies in line with your goals.
Understanding projected income flows
Retirement dashboards help forecast how your total income might evolve over time. They graph your projected cash flows, highlight expected drops or increases, and help you see if your current strategies are on target for the years ahead.
Can Dashboards Help With Retirement Healthcare Costs?
Rising healthcare costs are top-of-mind for retirees, and dashboards can be a valuable ally for tracking and preparing for these outlays.
Visualizing healthcare spending
With careful data entry, dashboards can show your healthcare spending patterns and help you anticipate future needs. Line or bar graphs highlight how your spending changes over time, making it easier to spot unusually high periods or identify opportunities to adjust coverage.
Tools for estimating future needs
Some dashboards include tools to input expected healthcare needs. These might offer benchmarks or let you model “what-if” scenarios—like new prescriptions or procedures—so you can see how your finances may be impacted in the future.
How to Interpret Dashboard Projections
Dashboard projections can be helpful, but it’s important to understand what they do well—and what their limits are.
Understanding growth estimates
Most dashboards use your current data, along with reasonable, commonly accepted assumptions, to estimate account growth or income trends. While these can provide useful guidance, keep in mind that market and regulatory conditions can change, affecting outcomes.
Recognizing dashboard alerts and warnings
Modern dashboards typically flag unusual data or alert you when spending rises faster than expected. Taking these prompts seriously can help you review your plans before small issues become bigger problems.
What projections cannot guarantee
No dashboard can promise future financial outcomes. While projections are useful for planning, it’s essential to treat them as guides—not guarantees. Remaining cautious about future assumptions will keep your strategy resilient.
What Are Common Pitfalls in Dashboard Use?
Even the most advanced dashboard isn’t foolproof. Watch for these mistakes so your retirement plan stays on track.
Overreliance on dashboard visuals
While graphs offer clarity, don’t let appealing visuals substitute for understanding. Dig into the underlying numbers and always question results that seem too optimistic or pessimistic.
Data entry errors to watch for
Incorrect entries, forgotten accounts, or small mistakes can distort your entire financial picture. Always double-check your information and update it regularly to avoid inaccuracies.
Periodic review for ongoing accuracy
Retirement needs change; so should your dashboard. Schedule regular reviews—at least annually—to keep your data up-to-date and ensure your dashboard reflects your current situation. This ongoing diligence helps you benefit most from your dashboard over the long run.